
Last Updated on February 9, 2022 – 4 min read
What are Space Invaders?
Invader is a famous street artist in the world, unidentified. He began installing his small, unique works in 1998, a large-scale project: Space Invader.
Do you remind this arcade 2D video games where you destroy aliens? The purpose of this street art project is to go beyond the video game, with an invasion of the real world. The artist fixed a series of invaders ceramics on the streets of cities worldwide.
The invasion starts in Paris, the city of the artist. Paris has been under invasion since 1998. New towns are continually invaded.
We count more than 80 cities invaded all around the world with several invaders waves: Paris, New York, London, Hong-Kong, Bilbao, Istanbul, Bangkok, Katmandou, Tokyo, Melbourne, Miami, Potosi, even underwater in the Cancun Bay, and in the space with mosaic art in the International Space Station (ISS)…

For more information on the Space Invader project, consult the official website of the artist. There is also a map of all the cities invaded. There are about 1 450 space invaders in Paris and more than 4 000 worldwide.
Since 2014, the artist has developed an application game named « Flash Invaders » available for IOS and Android.
This application allows you to flash Space Invaders by taking a photo of the ceramics.
You win 10 to 100 points depending on the flashed space invaders. Your score allows you to compete with others players in the application. There are more than 100,000 players in the world. You can follow your rank in the high scores tables.

To know the latest invasions you can follow the Instagram account of the Invader artist.
Why I like this project ?
Thanks to this street art, you can discover new cities by walking randomly, to hunt and capture this beautiful art on the wall, often with funny references.
Discover, walk and compete.

What is the link between this street art project and Python?
Walking randomly in the streets is nice, however, if you are a competitor, when you will visit a city once, it will be better to have a methodical approach to avoid missing Space Invaders and flash the maximum points.
The purpose below is to combined Space Invaders research with data visualization in Python using the Folium package to have a better approach.
How can you use Python to have a quick view of our space invaders research in the world?
Thanks to the latitude and longitude retrieved from several space invaders found in Paris, we will see how to draw a map with the space invaders that I found and the space invaders that I located but not yet flashed.
First, you need to upload a database with the following columns: name of a space invader, latitude, longitude, and a binary flag to know if you already flashed the space invader.
| Name | Pts | Latitude | Longitude | Location | Flag Already Flashed |
|---|---|---|---|---|---|
| PA_1103 | 50 | 48.8290747 | 2.3535586 | 48.8290747,2.3535586 | N |
| PA_1093 | 30 | 48.8406879 | 2.3695804 | 48.8406879,2.3695804 | N |
| PA_1104 | 100 | 48.8341492 | 2.3644626 | 48.8341492,2.3644626 | N |
| PA_1109 | 30 | 48.8233596 | 2.3655497 | 48.8233596,2.3655497 | N |
| PA_1134 | 20 | 48.8271209 | 2.3671137 | 48.8271209,2.3671137 | N |
| PA_1178 | 30 | 48.821515 | 2.3687695 | 48.821515,2.3687695 | N |
| PA_1179 | 30 | 48.8306369 | 2.3564637 | 48.8306369,2.3564637 | N |
| PA_1180 | 20 | 48.8349713 | 2.3533438 | 48.8349713,2.3533438 | N |
| PA_1228 | 50 | 48.8344489 | 2.3576587 | 48.8344489,2.3576587 | N |
| PA_1240 | 100 | 48.8334701 | 2.3632508 | 48.8334701,2.3632508 | N |
| PA_1316 | 50 | 48.8249126 | 2.3624461 | 48.8249126,2.3624461 | N |
| PA_1330 | 30 | 48.836236 | 2.3550765 | 48.836236,2.3550765 | N |
| PA_1331 | 40 | 48.8268783 | 2.3544322 | 48.8268783,2.3544322 | N |
We divide our data into two dataframes based on the flash binary flag.
import pandas as pd
import folium
from folium.plugins import MeasureControl

# initialisation input file data  xlsx
path_file_database = "/Users/VBA Skills/Data_invaders.xlsx"
df_data = pd.read_excel(path_file_database, index_col=None)

# pre processing data
df_data["Longitude"] = df_data["Longitude"].astype(float)
df_data["Latitude"] = df_data["Latitude"].astype(float)
Now, we create a geographical map using the Folium package.
# initialisation of a new map
map_draw = folium.Map(location=[df_data.Latitude.mean(), df_data.Longitude.mean()],
                      zoom_start=6, control_scale=True, tiles="CartoDB positron")
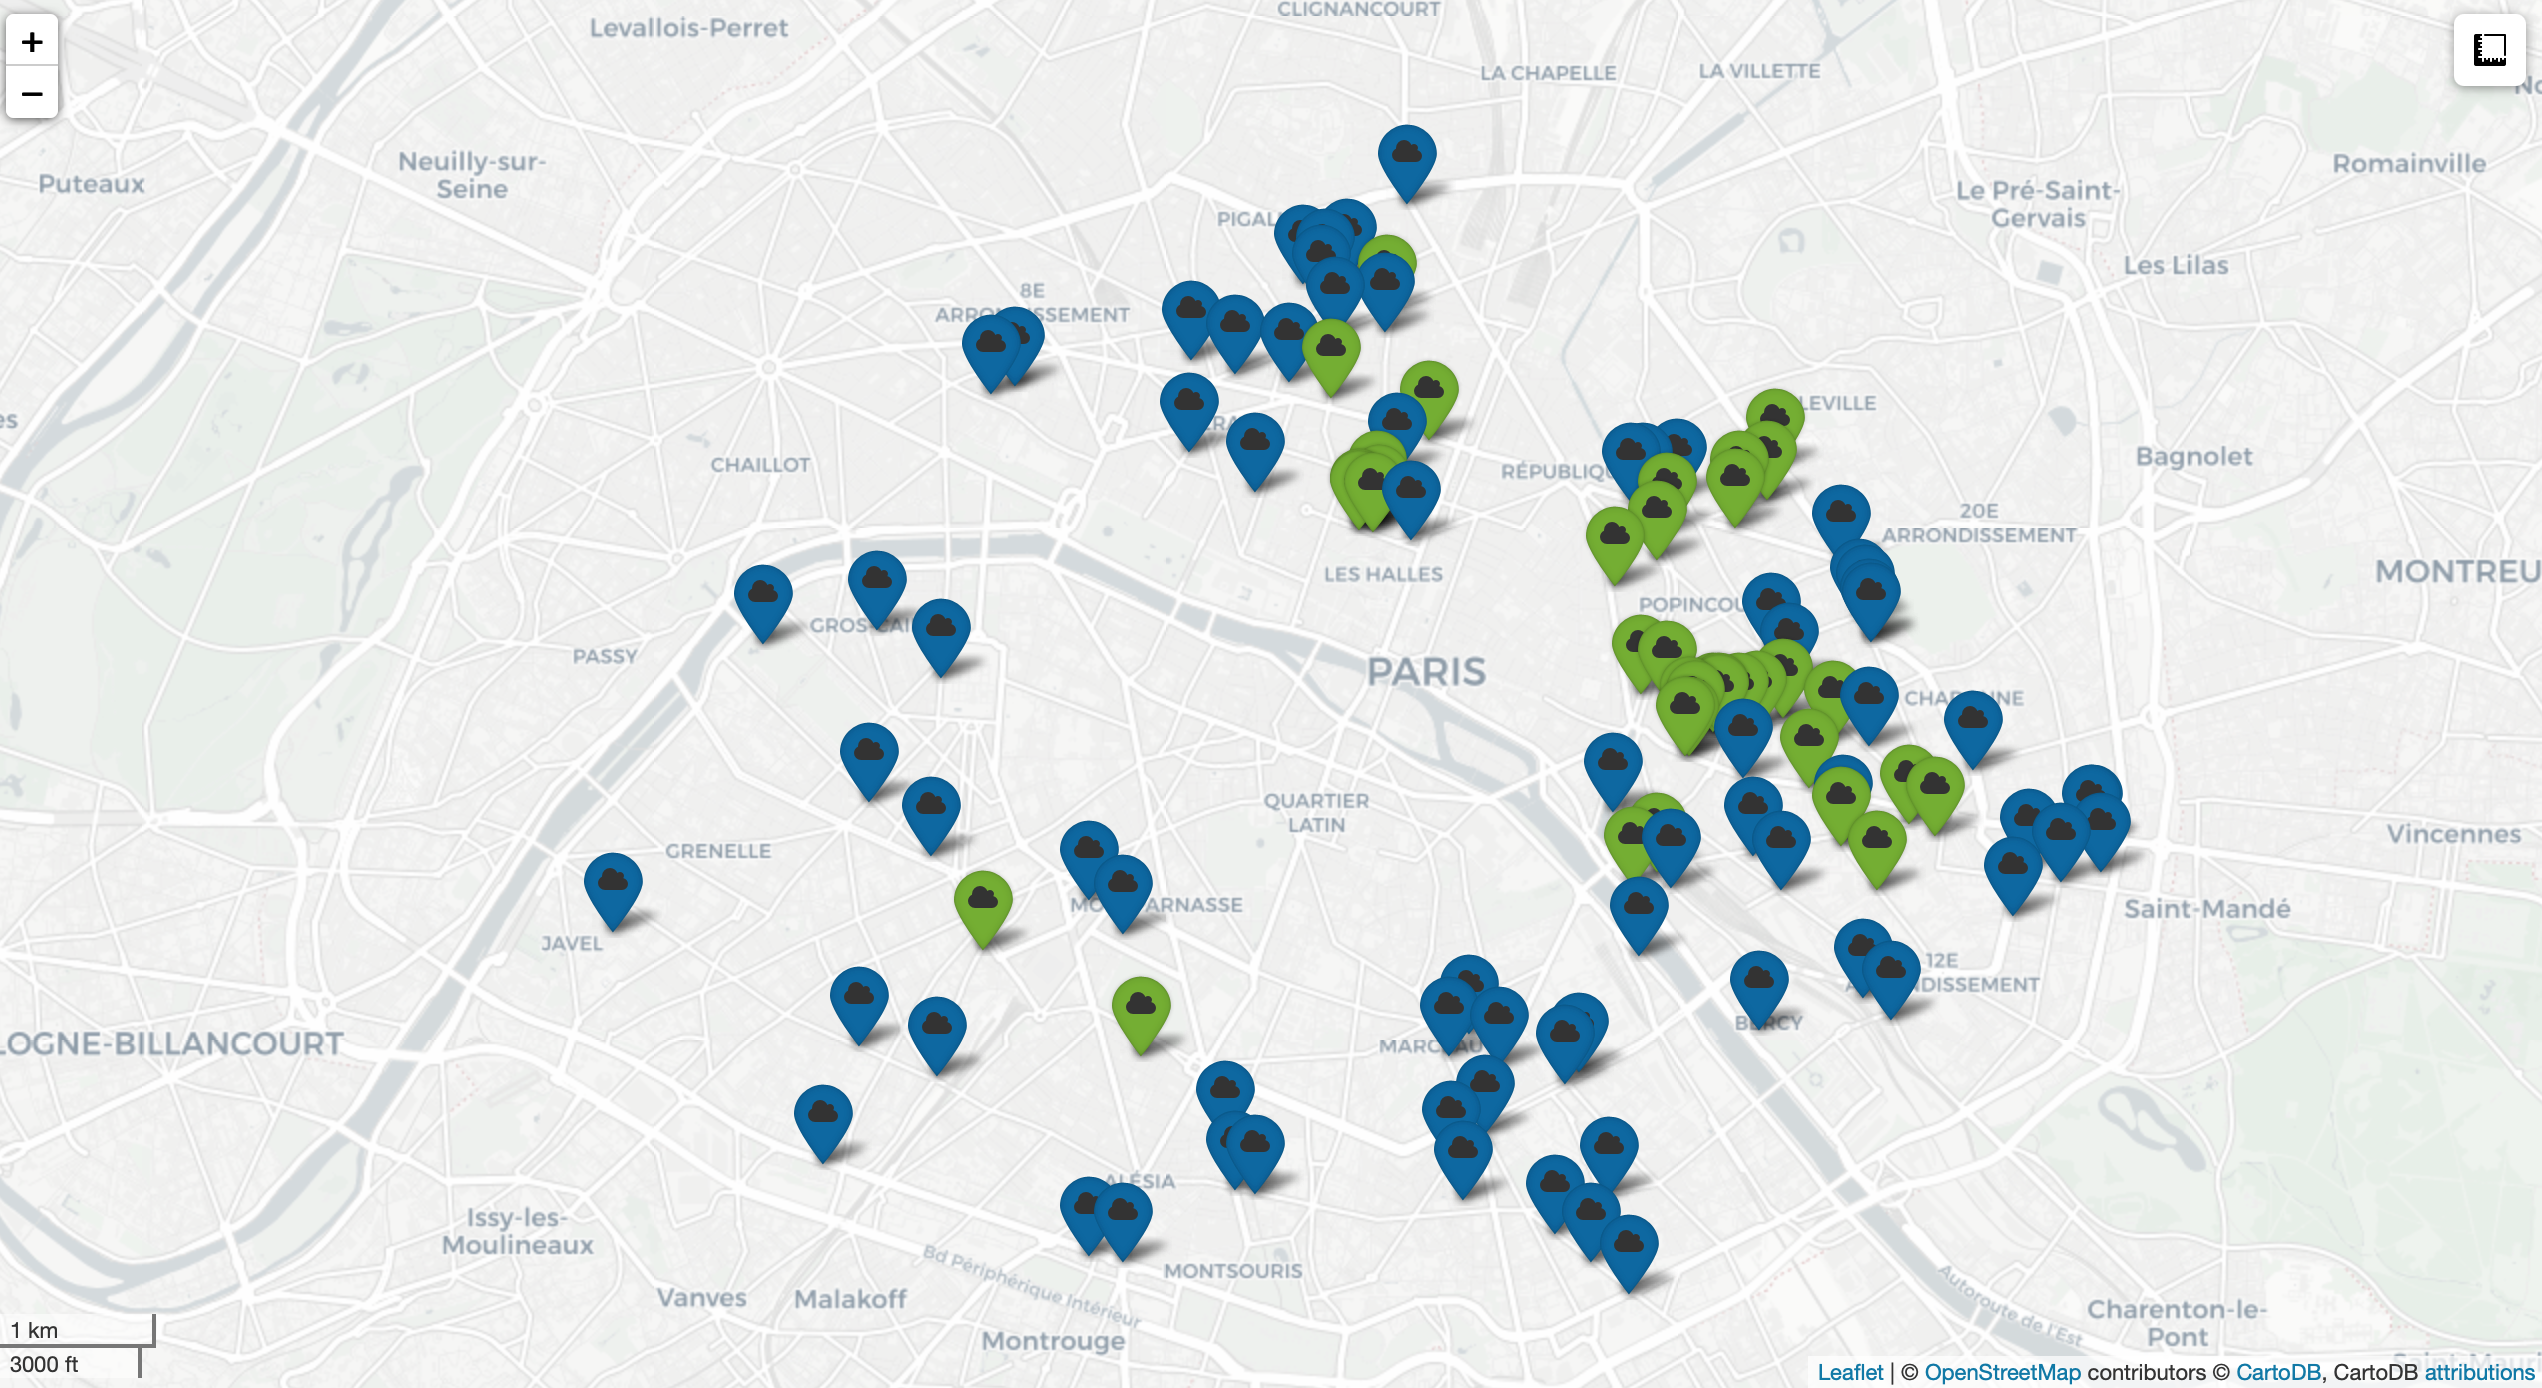
We add data from the two dataframes separately on our map :
- space invaders already flashed in green
- space invaders not flashed in blue
# create two dataframe
df_data_already_flashed = df_data.loc[df_data['Flag Already Flashed'] == "Y"]
df_data_to_flash = df_data.loc[df_data['Flag Already Flashed'] == "N"]

# add the green marker already flashed on the map
for index, location_info in df_data_already_flashed.iterrows():
    folium.Marker([location_info["Latitude"], location_info["Longitude"]],
                  popup=str(location_info["Name"]) + " \n " + str(location_info["Pts"]),
                  icon=folium.Icon(color="green", icon_color="#FFFFF", icon="cloud", prefix="fa")).add_to(map_draw)

# add the blue marker to flash on the map
for index, location_info in df_data_to_flash.iterrows():
    folium.Marker([location_info["Latitude"], location_info["Longitude"]],
                  popup=str(location_info["Name"]) + " \n " + str(location_info["Pts"]),
                  icon=folium.Icon(color="darkblue", icon_color="#FFFFF", icon="cloud", prefix="fa")).add_to(map_draw)

# add the plugin measurement
map_draw.add_child(MeasureControl())

name_output_file = "Map_space_invaders.html"
map_draw.save(name_output_file)

print("Process Done !")
Toudoum! Your results are saved in an HTML file. You can have a better view of your Space Invaders research with a short Python
Below is the same map with a zoom on the 11 arrondissements.
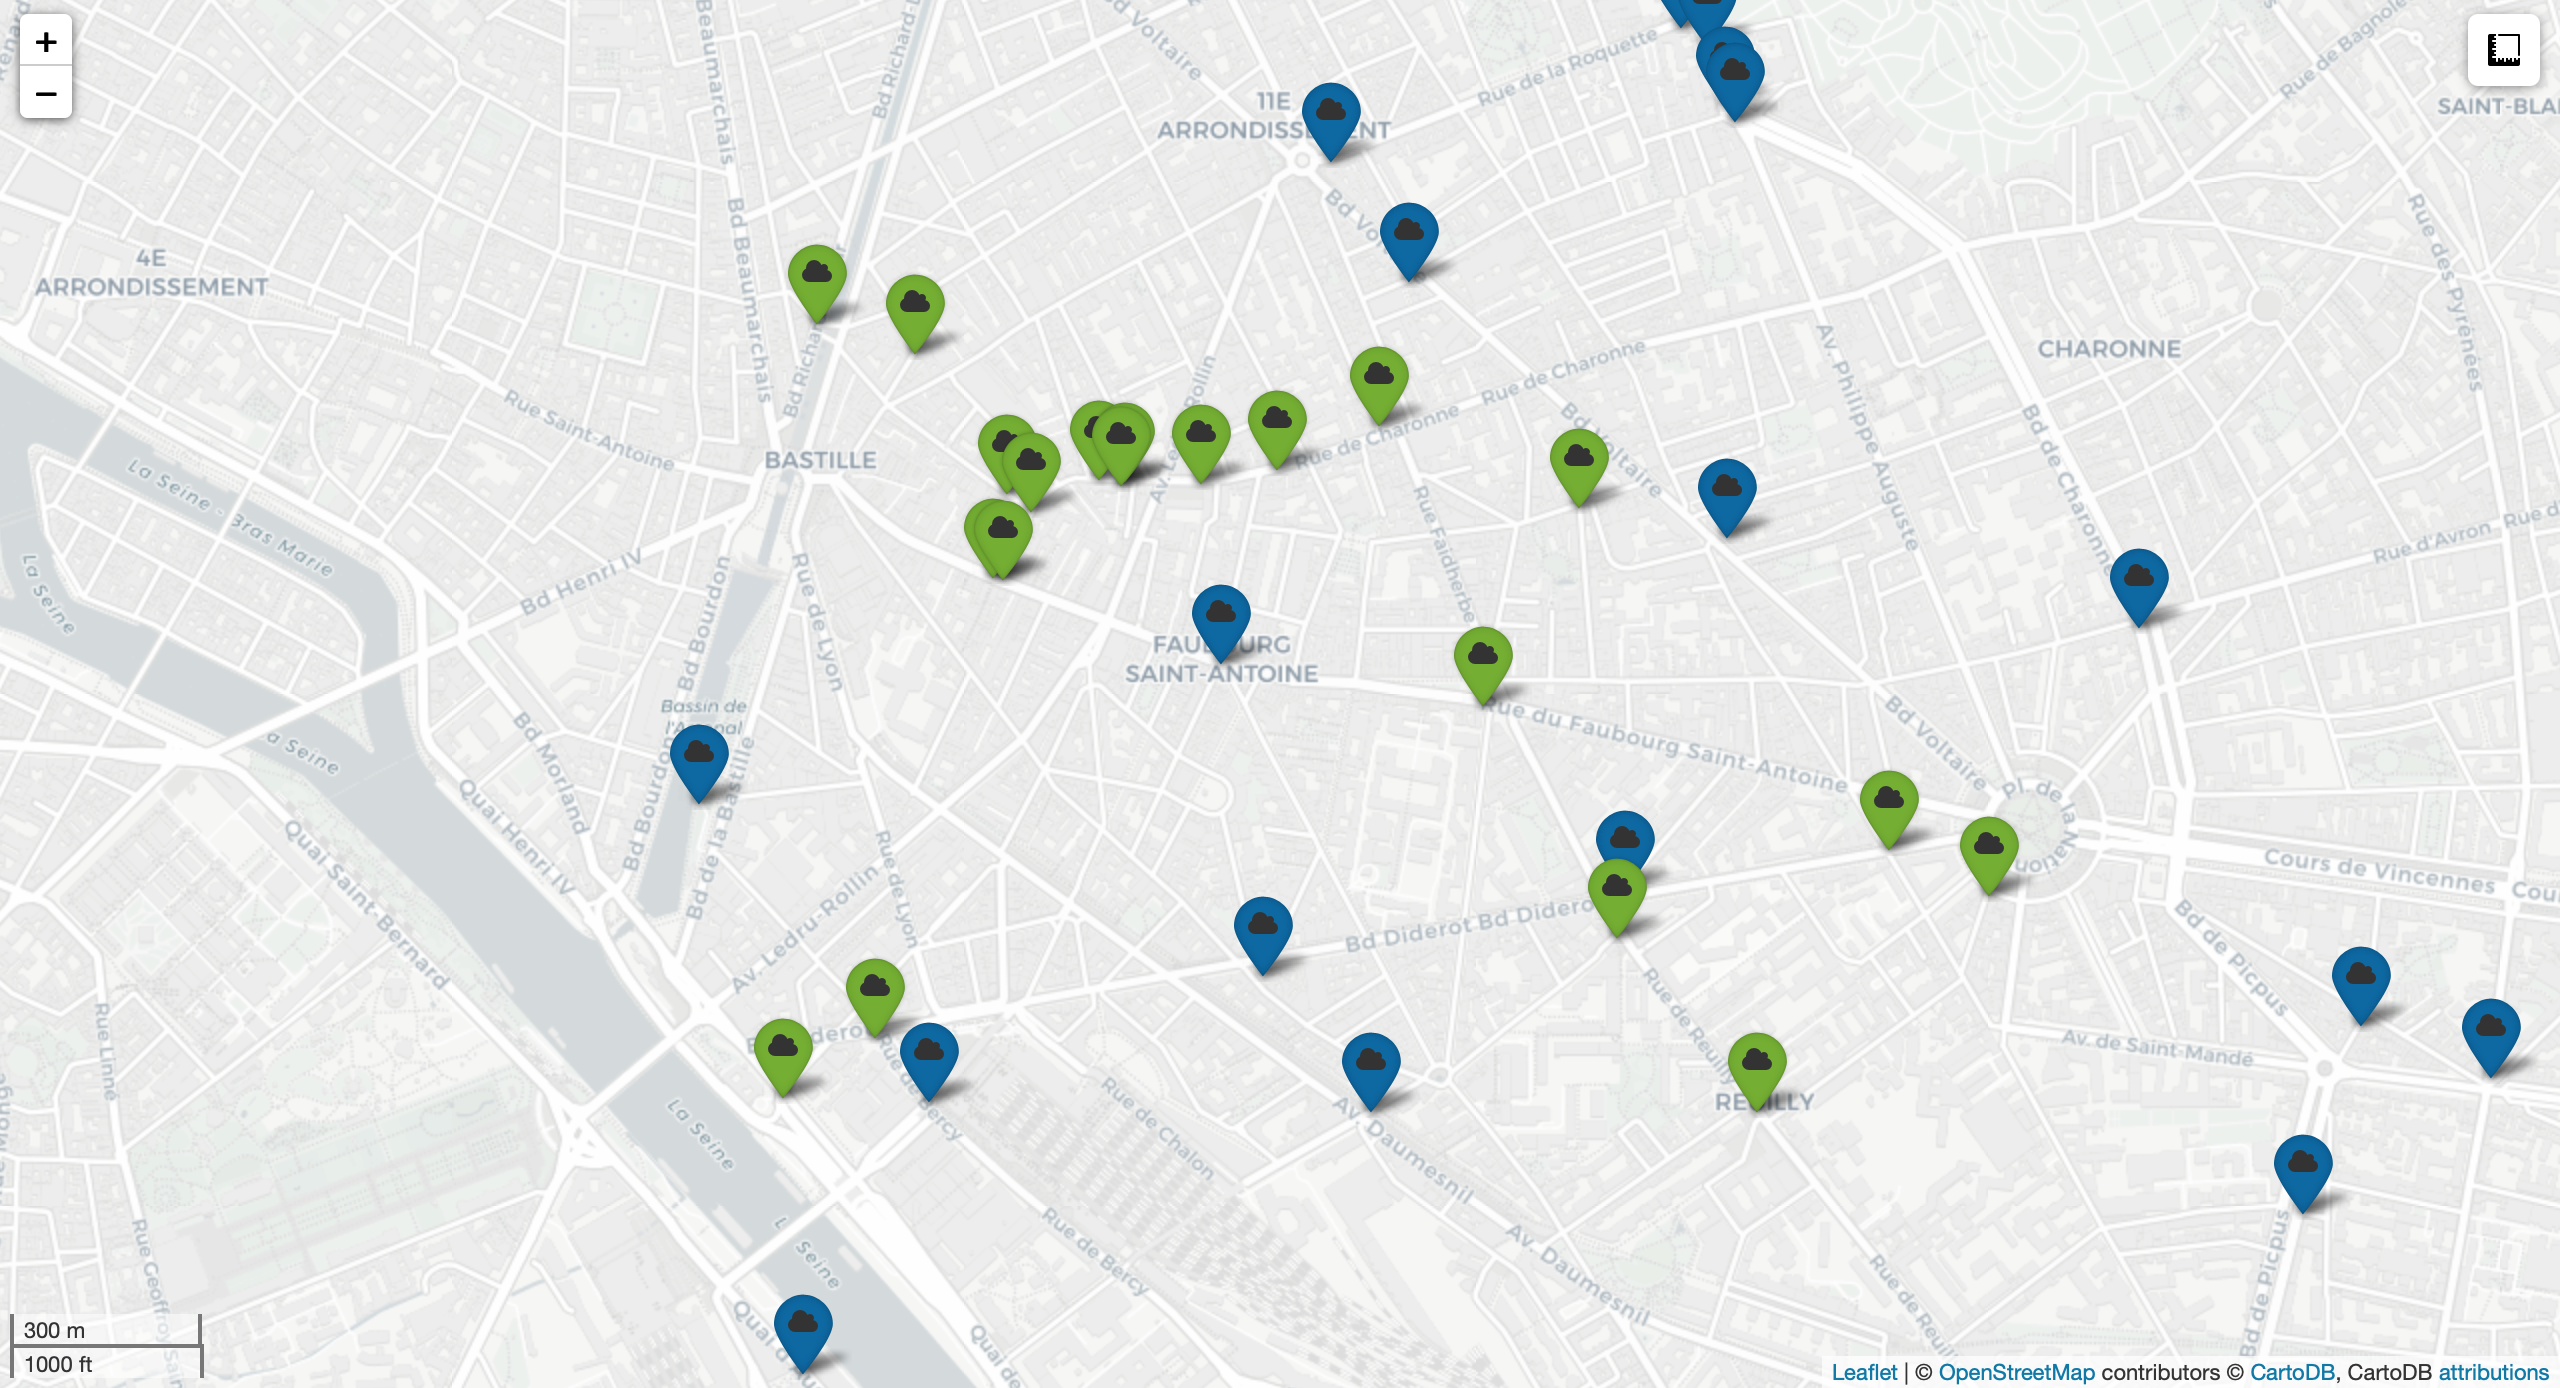
You need to update your database with new data to follow up on your research and run the same code at each update.
You see that it is easy to combine the fun of a game, walking to discover new cities, and a data visualization approach with Python!
Have fun & good luck with your hunt!
